What Does The Frequency Response Say?
|
We are used to evaluating loudspeakers using 2-D frequency response diagrams. Of all the measurements of a loudspeaker, the frequency response is the one most often displayed and evaluated. It is the result of a frequency analysis of the respective measurement signal used and sometimes it is the only measurement announced by a manufacturer. This is based on the erroneous assumption that the sound pressure frequency response of a loudspeaker provides exhaustive information about its acoustic properties and is also available in the specified bandwidth of music reproduction, that it is time-invariant. But this is exactly not the case. There are said to be people who are so bold as to draw conclusions about the acoustic qualities of a loudspeaker from its sound pressure frequency response alone. But even the three-dimensional decay spectrum, by adding the time axis, reveals things that can at best be guessed at from the amplitude frequency response. Therefore, several aspects will be considered in the following, which deal with the statements attributed to a frequency response. ContentsFormation of a sound sum[edit]All parameters (e.g., the group delay, linear amplitude frequency response, and others) are important for signal formation, that is, for reconstruction of the input signal. Each parameter is a part of the whole conversion process, no single parameter can form a signal. Accordingly, an amplitude frequency response cannot represent a sound. Therefore, one cannot take out individual parameters and evaluate their importance. |
The time component[edit]Sound events are changes in sound pressure over time. The very word change refers to the temporal progression. Sound is the time sequence of pressure intensities. Since we hear sound, we hear the time sequence of pressure intensities. We hear pressure time courses, never just the time relations or just the pressure values. Therefore, statements about hearing time-correctness are abstract and do not describe what is really heard.
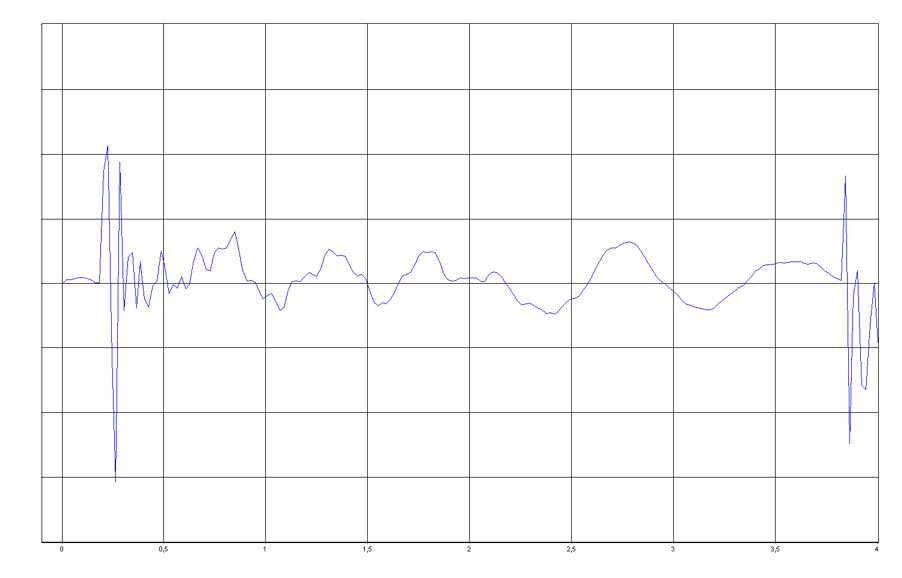
Frequency responses in themselves are not an audible event. The figure also clearly shows the enormous difference in loudness of the transients compared to the subsequent oscillations. The transients are many times louder. In addition, the 30-fold increase in nerve firing rate, the drastically increased attention of the auditory sense, allows us to accurately pick out the transients even in a mixture of overlapping sound waves. |
|
This also applies to the other 2-D frequency diagrams:
group delay However, no normal human being is able to mathematically calculate back to the original signal by looking at various diagrams in his head. In music recordings, signals are displayed in an oscilloscope representation so that the sound engineer can recognize and process them. Oscilloscope plots show the signal over time, not but its frequency response. As a skilled sound engineer, you have an eye for what event, for example, the onset of a drum kit represents. Moreover, these oscillations can be easily played back and made audible. Oscilloscope plots, unlike frequency response, represent an audible event. Without them, frequency response diagrams are impossible to interpret sonically. This interpretation is also extremely difficult. Unlike amplitude-frequency response diagrams, however, two identical oscilloscope representations cannot possibly represent two different sounds. |
Since frequency response measurements focus on amplitude values of the steady state, which only include transient processes to a small extent, they unfortunately say little about the sound of a loudspeaker and the sound of the resulting room reflections. Beyond the frequency response measurements the question arises: What is actually hidden behind a frequency response? A linear frequency response can be obtained even from a loudspeaker that doesn't reproduce a single signal cleanly.
As can be shown by measurement, the first half waves of a sinus oscillation clearly differ from the following oscillations. However, this is not reflected in the frequency response. But since we hear this sequence of oscillations, we have no information about the sound event that is hidden behind a frequency response diagram. Therefore, only measurements that show the whole also allow unambiguous conclusions to be drawn about the whole.
Frequency response measurement[edit]With a frequency response measurement the loudspeaker is usually supplied with a measuring signal, which covers at least the frequency bandwidth set in advance. With the help of either a preset or a user-defined tracking filter, the segment of the measurement signal to be evaluated is determined. (This is roughly like looking out of a window at a passing train).
The required mathematical evaluation is based on the steady state of the loudspeaker during the measurement process.
The calculated amplitude values and their frequency assignment refer to the "steady state" for measurements of this type.
The sound pressure structure within the measurement window is quantitatively evaluated, converted into amplitude values and assigned to the frequencies. The actual sound pressure structure of the sound radiated by the loudspeaker is lost in the process. The time factor is excluded from frequency response measurements. The measurement window covers a larger period of time at low frequencies than at high frequencies because a low-frequency sound wave is a longer wave (fewer oscillations per second, thus more time per oscillation).
Therefore, especially room reflections at lower frequencies, and depending on the proximity of the reflection surface, are also detected within the measurement window. (This is then approximately as if a truck would pass in front of our window while the train is passing).
In the frequency response, one therefore increasingly sees corresponding ripples at lower frequencies.
The dynamic process[edit]The waveform of direct sound depends on the waveform radiated by the loudspeaker at an angle. In the course of the oscillation process (transient - decay) the loudspeaker passes through countless, very different frequency responses. This is caused by the different speed of the transient and decay processes of the individual drivers. The maximum amplitude, as it is visible in the transient frequency response, is not reached by all drivers at the same speed. Likewise, the decay after the signal is not equally fast. Each chassis has its own time constant with which it reacts to dynamic signals. If this time constant were identical for all drivers, then the frequency response would also be identical at all times - regardless of whether the drivers oscillate in and out quickly or slowly. However, it is almost impossible to find several drivers with the same time constant. Thus, over the time course of an incoming impulse, certain frequency ranges reach their maximum amplitude faster than others. However, these distortions in the summation of the overall signal are not reflected at all in the transient frequency response as it is published for loudspeakers. Even if the frequency response is very flat, the dynamic behaviour of the individual drivers can be inhomogeneous. Example: If you pluck a guitar string and analyze the frequency spectrum over the time course, you will get a different spectrum at each point in time. If you were to pick one of these spectra and claim it represented the guitar sound, you would be wrong. Accordingly, the bandwidth of a loudspeaker cannot be given by a frequency response from... to. Two models, e.g. with cut-off frequency (-3 dB) at 35 Hz, can differ so much in their low bass response that this statement is reduced to what it actually is, namely completely worthless. In the manufacturers' data sheets one often finds information about the lower and upper cut-off frequency, sometimes without any indication of how many dB the sound pressure level has dropped at the given frequency, sometimes with an indication. Let's have a look at the specifications, which are seriously given with -3 dB. Without an indication of the high pass characteristics (12, 18, 24 dB/oct.) the indication of the lower cut-off frequency is of no real significance, as it is the only way to find out how steeply the sound pressure level drops:
4th order high pass = 24 dB/oct. means: One octave (halving of the frequency) below the -3 dB point, the sound pressure has dropped by a further 24 dB, i.e. at ≈ -27 dB. |
|
For example, comparing two speakers with the same -3 dB cutoff frequency and the same high-pass characteristics, the two may be worlds apart in bass response, because the difference, as is almost always the case when everything seems the same, is not in frequency response, but in dynamic behavior. In low frequency reproduction, what counts is:
the speed of the diaphragm
the maximum linear excursion the linearity of the magnet system/drive system the characteristics of the mechanical suspension
And all crucial, the playback room! The same applies to the upper end of the transmission.
The waterfall diagram[edit]This is a special measurement model to show the frequency response over time. It involves rectifying the original sound structure: The polarity, overpressure and underpressure, is equated, that is, the signs disappear and so does a substantial part of the information. And the amounts of the sound pressure values are represented by an envelope curve of the original sound structure of equal times. What remains of the statement is: In certain frequency ranges, increases or decreases of the amounts of the sound pressure values from the envelope curve of the rectified original sound structure show up in the course of time. This is exactly the significance. So you have to know exactly what the measurement conditions of a measurement procedure are in order to know what you can read from it. |
The distortion factor[edit]
For the distortion, i.e. the non-linear distortions, the same applies as for the frequency response. Due to the maximum sensitivity of the auditory sense at the transient, at the transients, distortions of these are of highest importance. The loudest parts in music are the transients, which are also crucial for the detection and localization of sound events. However, distortion is normally measured in the steady state. In this case, the distortion values of loudspeakers are often already considerably high. Measurements in the steady state can only show the distortion in the steady state. The more half waves the measuring signal contains, the better the loudspeaker can follow it and the "distortion part" of the first half waves is statistically only slightly included in the result. The distortion of applause, for example, is not detected at all with the usual measurement methods! These sound events are very brief and do not exhibit a steady state; they are just noises.
Considering the dynamic signal structures of music, distortion values of conventional measurements are practically meaningless for listening. Prospect distortion values are without any practical significance. This is because the amplitudes of the transients, at the beginning of a sound event, are often higher than the steady-state signals and therefore have a different distortion factor.
Of course, this distortion can only be measured during the transient (step measurement). Apart from that the distortion increases extremely depending on the non-linearity of the drive of the chassis. Only the dynamic distortion (impulse distortion) reflects the distortion in actual operation. It's not just a few percent, it's a completely different sound!
Linear Distortion[edit]
In addition to distortion, there is also linear distortion of the signal due to, for example, the acoustic centers of the drivers. These distortions also contribute significantly to the distortion of the amplitude and the waveform of the music signal, but they are not even captured by the distortion factor! The overall distortion of a loudspeaker is therefore greater than the distortion factor indicates. The amplitude errors are particularly large in the Swing-in.
Equalizer - a medicine with side effects[edit]Anyone who has ever linearised the frequency response of a loudspeaker in a room to a large extent, either by automatic software or by hand, will notice that the sound does not achieve the best possible result - as theoretically expected - but quite the opposite: the music seems lacking in energy, slowed down, undynamic and generally disappointing. If the linear frequency response had the tonal significance that is generally attributed to it, this result would be inexplicable. However, it can certainly lead to improvements if a few selected frequency ranges are corrected with restraint. In this case the advantages outweigh the disadvantages. However, a deep intervention into the signal will always lead to a negative result. With knowledge of the previous sections you will find explanations for this. A parametric equalizer is a tool. It does not only change the volume within a frequency range, but intervenes in a more complex way in the signal shapes. The decisive factor is always the shape of the sound waves. The tonal change is therefore made by changing the waveforms. From changed waveforms, model-theoretical parameters can be derived again. Example: |
<zurück: Myroklopädie>
<zurück: Myro>


